Visualizing experiences
My thesis is an exploration of data visualization, human emotions, and capturing experiences as we keep up with the formats of digital media. In this pitch, I propose a new alternative for capturing the experience visitors have at museums, and aim to relate to those who cherish memories and personal stories. I use the interactive exhibit at the Myseum of Toronto as my case study for my digital interface.
When I started this project I knew I wanted to:
visualize data and tell a story
create an experience …. a positive one?
focus on human emotions and stories
focus on the museum experience
The end goal: create a personalized museum souvenir using data visualization based on each visitor’s interactions at the exhibit.
May - August 2022
How can we capture moments and sensations in creative formats?
I started my research process by combining secondary and primary research methods. I investigated topic precedents, such as emotion visualization projects like Atlas of Emotion by Stamen, the thesis study Fine by Anne Wiederkher, and Dear Data by Giorgia Lupi and Stephanie Posavec.
I did a lot of observational research at different museum exhibits, such as the Art Gallery of Ontario, the Power Plant in Toronto, and Mindworks: The Science of Thinking in Chicago. One of the main takeaways I focused on is that museum visitors are more inclined to stop and interact with interfaces when they are placed as part of the story.
Simultaneously, I was having conversations to explore and decide on data collection methods that would best fit this concept, which I later adapted to the exhibit I chose. I also created short surveys to get first hand user information about people’s behaviors, motivations, and preferences when they go to a museum
I found that:
There are different types of museum visitors, but the ones I should focus on as my audience are experience seekers
Based on survey answers, many visitors attend exhibits to “experience art or something different” and will most likely buy (or feel the urge to) purchase a souvenir afterwards
Research process

Dear Data postcard

Mindworks visit in Chicago
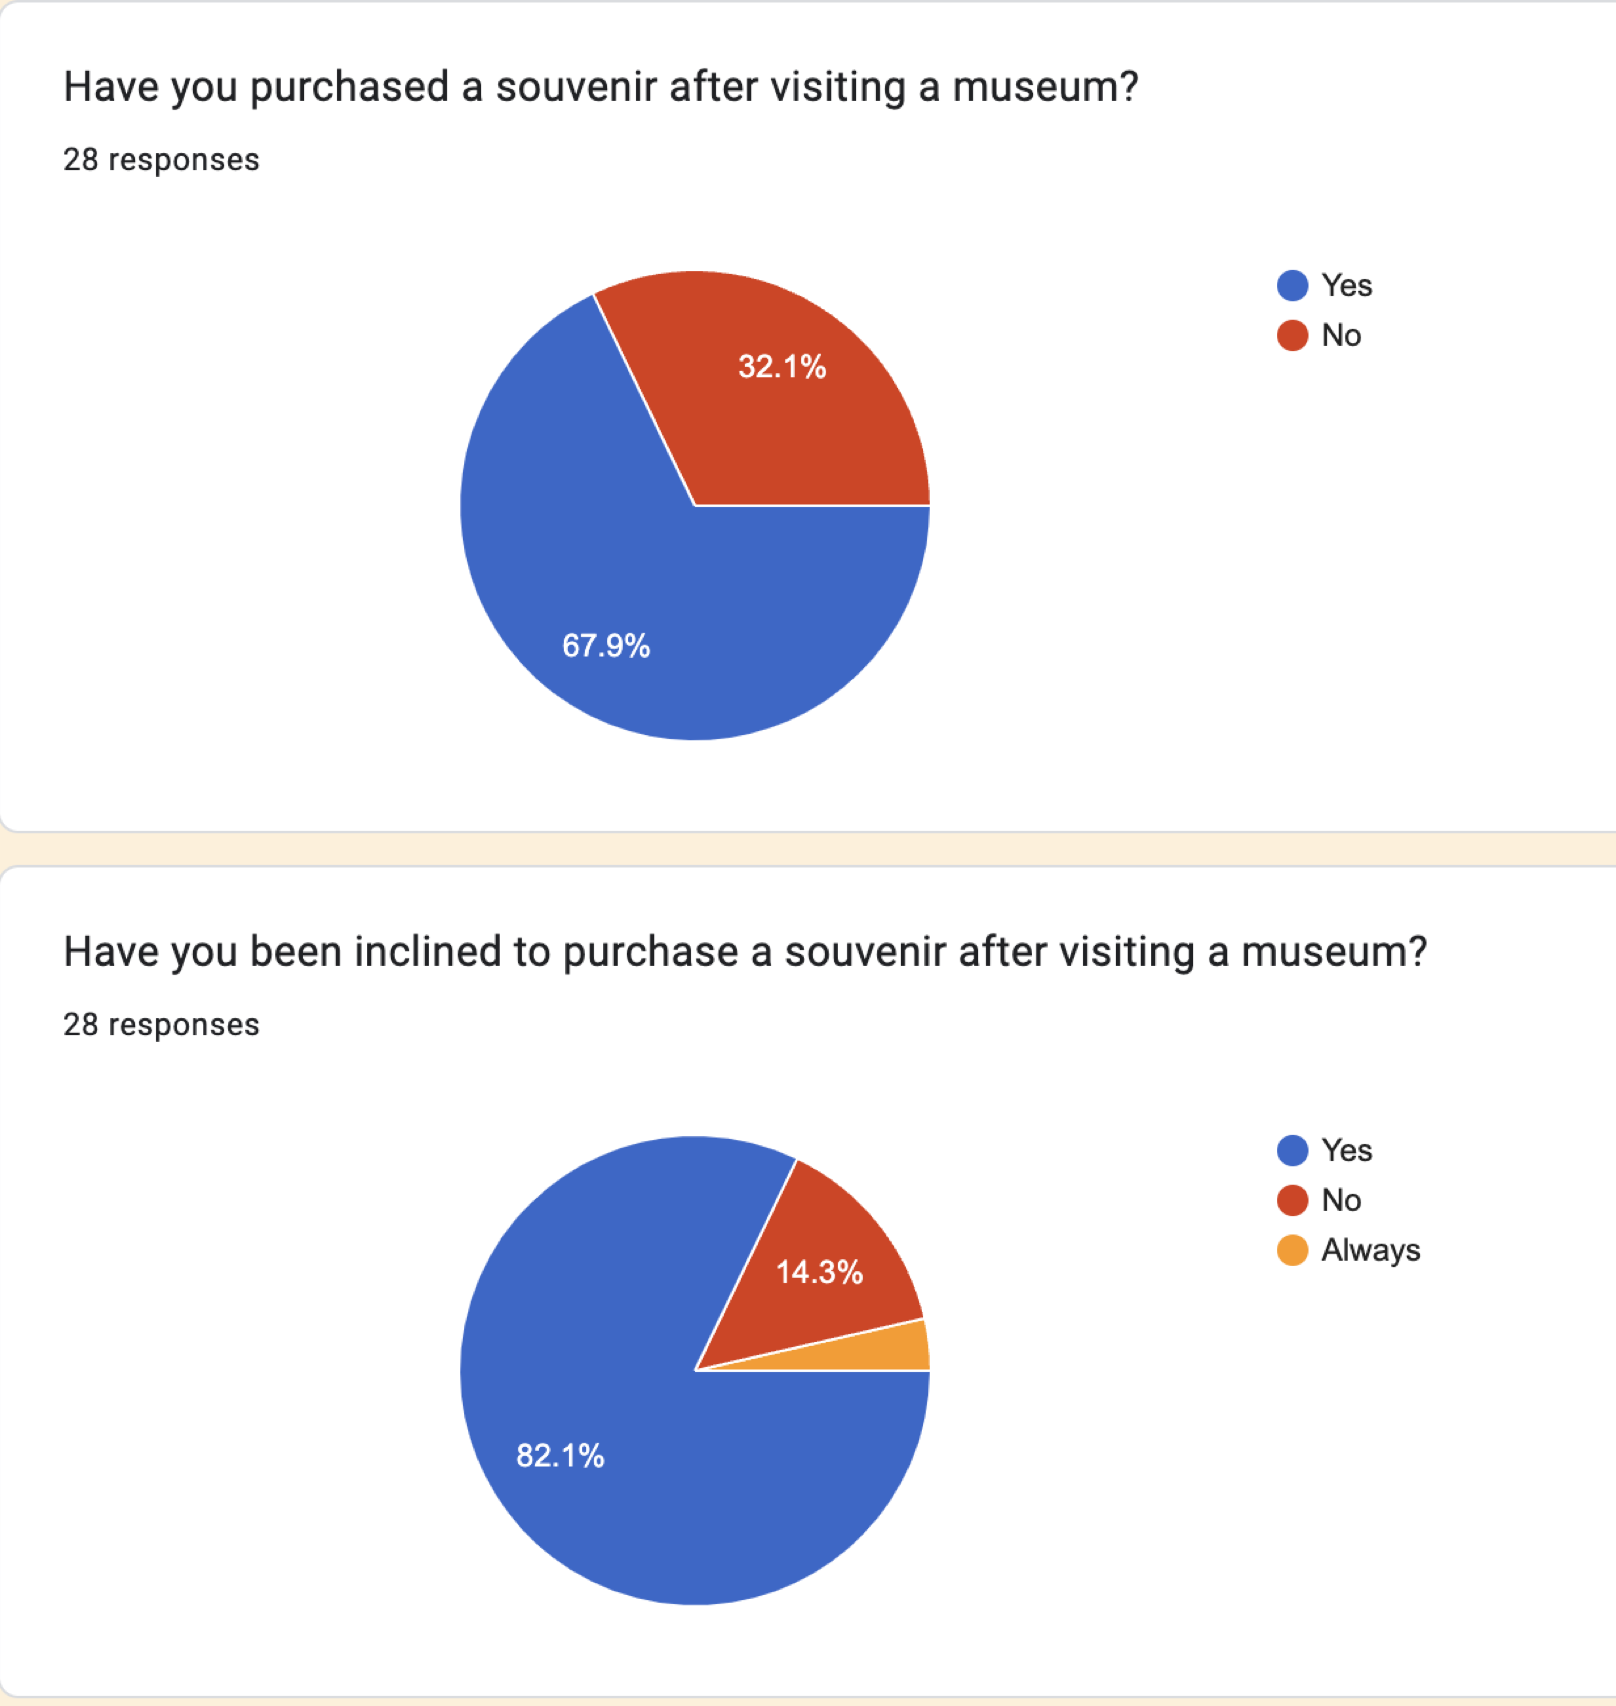
Survey answers
"Fine" by Anne Wiederkher, how to record emotion
So, why are interactive exhibits effective, and how can they become more meaningful to visitors? In what ways can museum visitors feel connected to their museum experience?
Case study
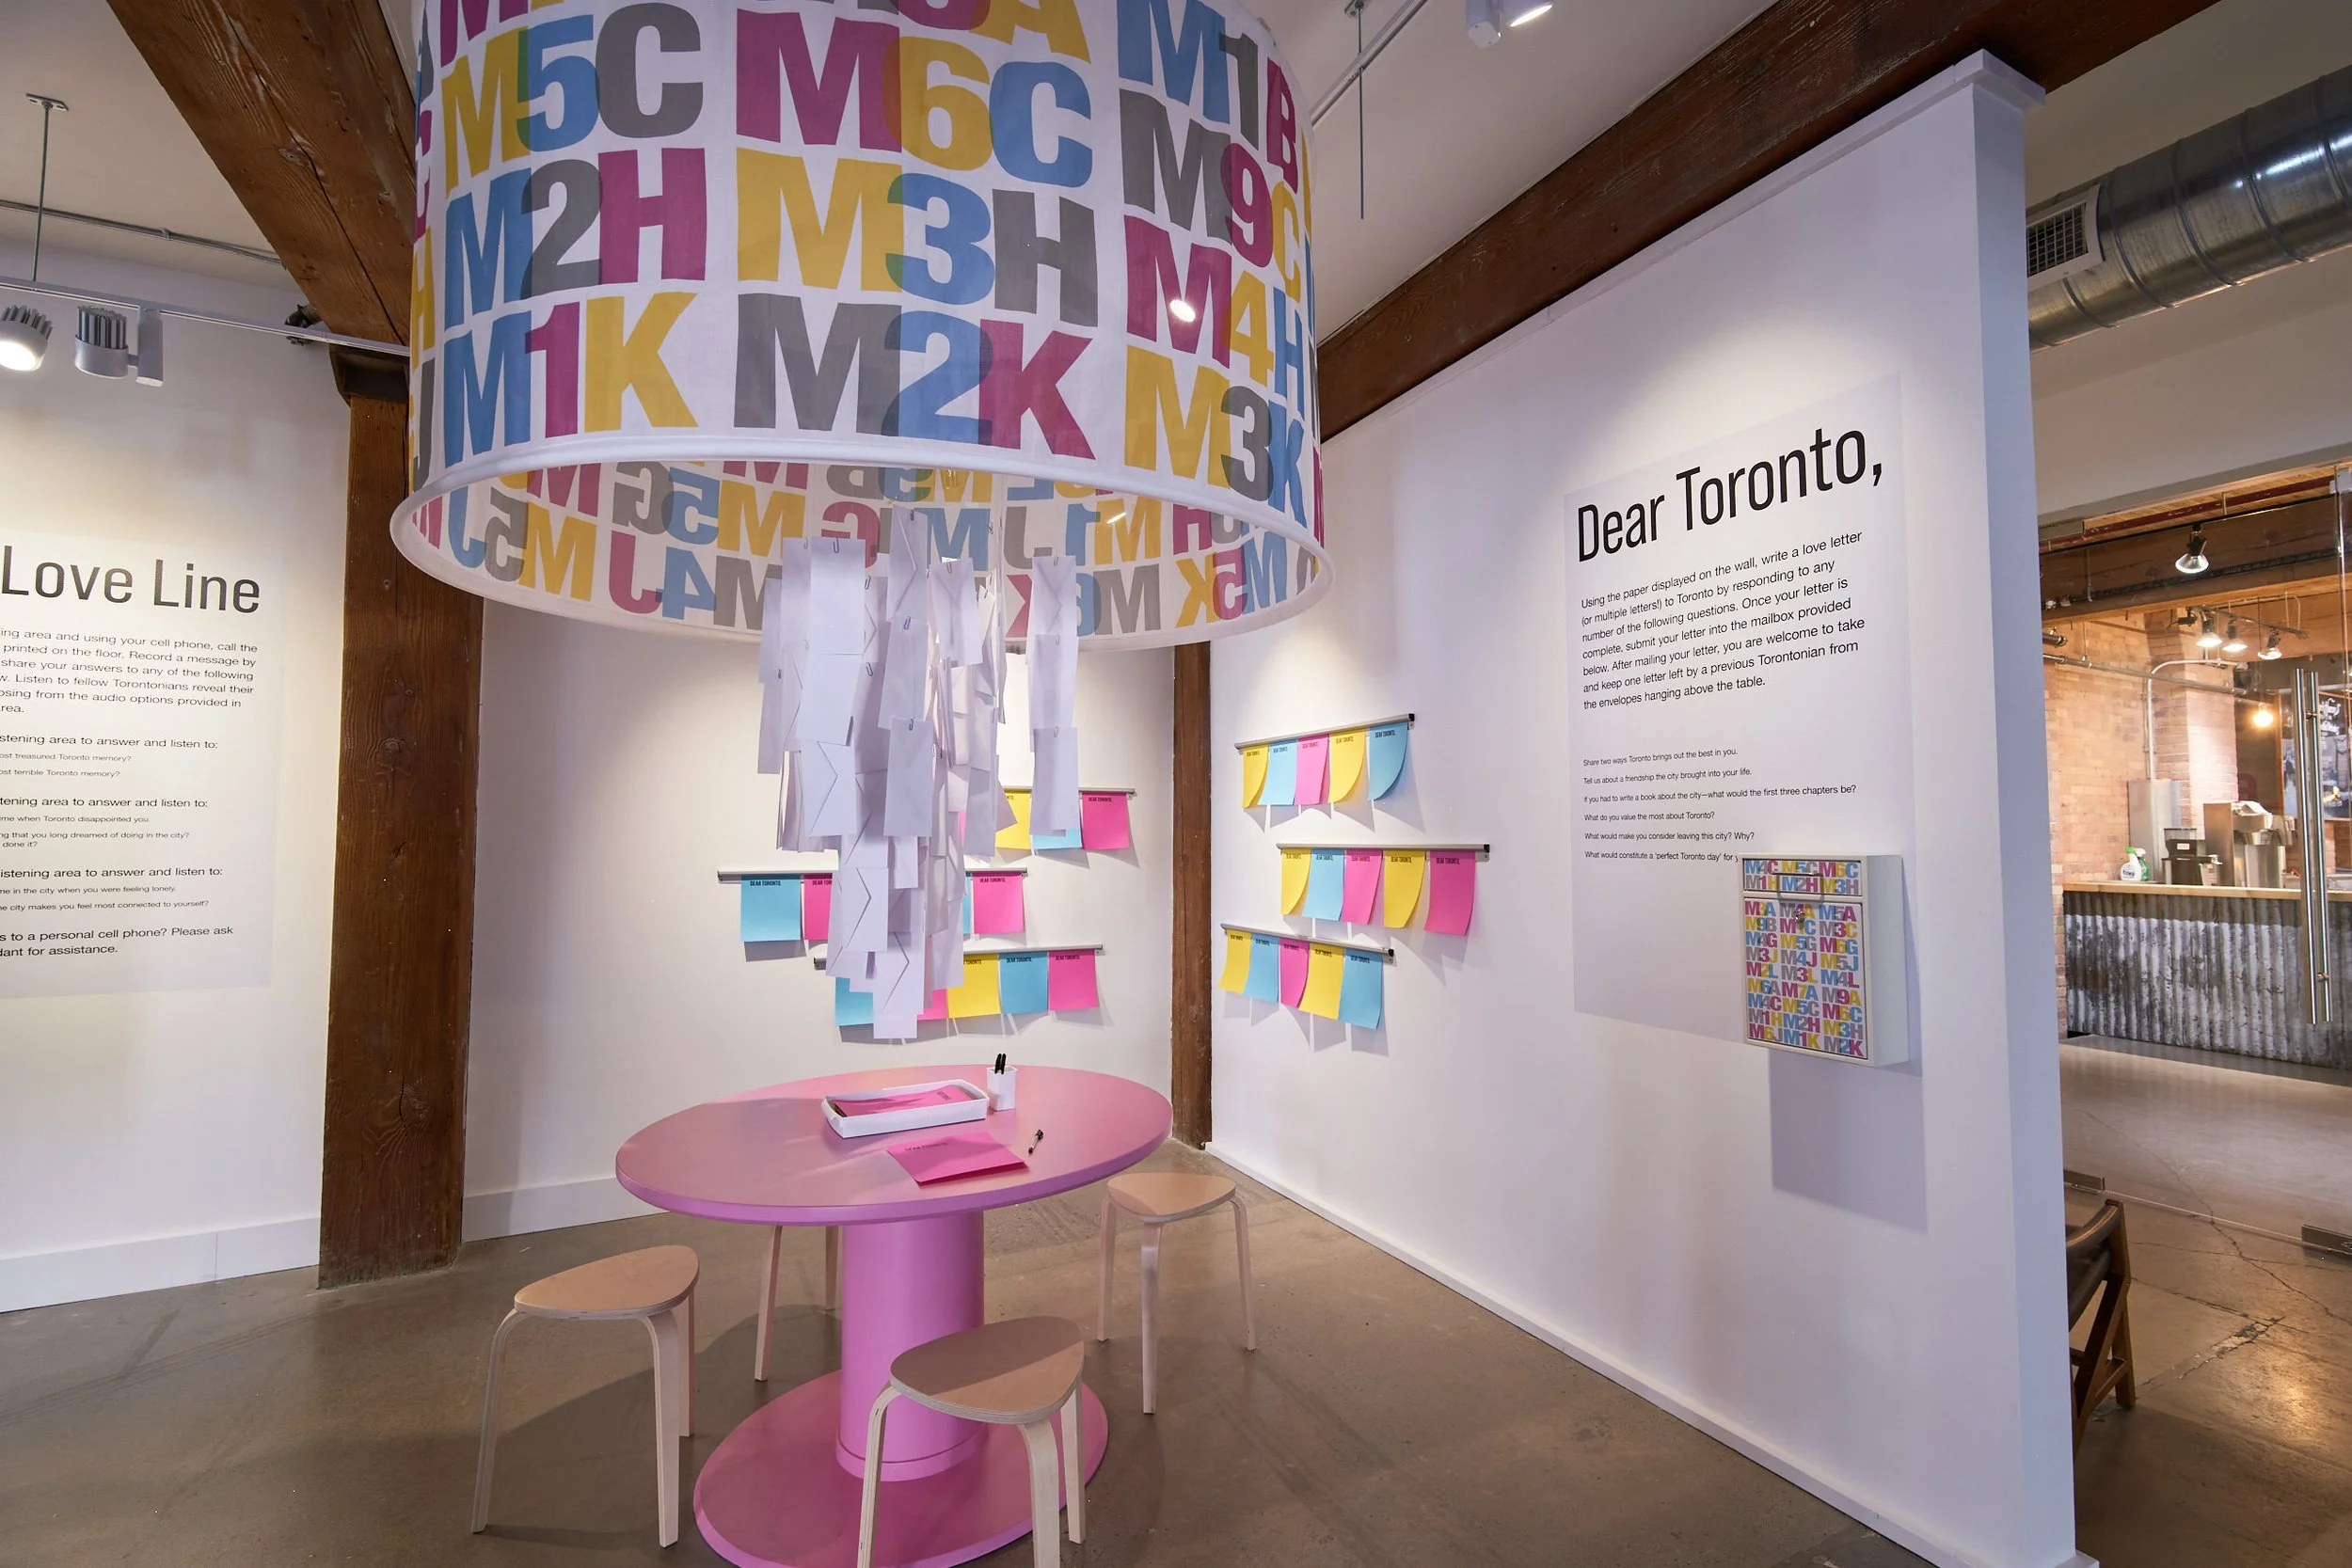
I used the exhibit at the Myseum of Toronto as my case study and based my prototype around it.
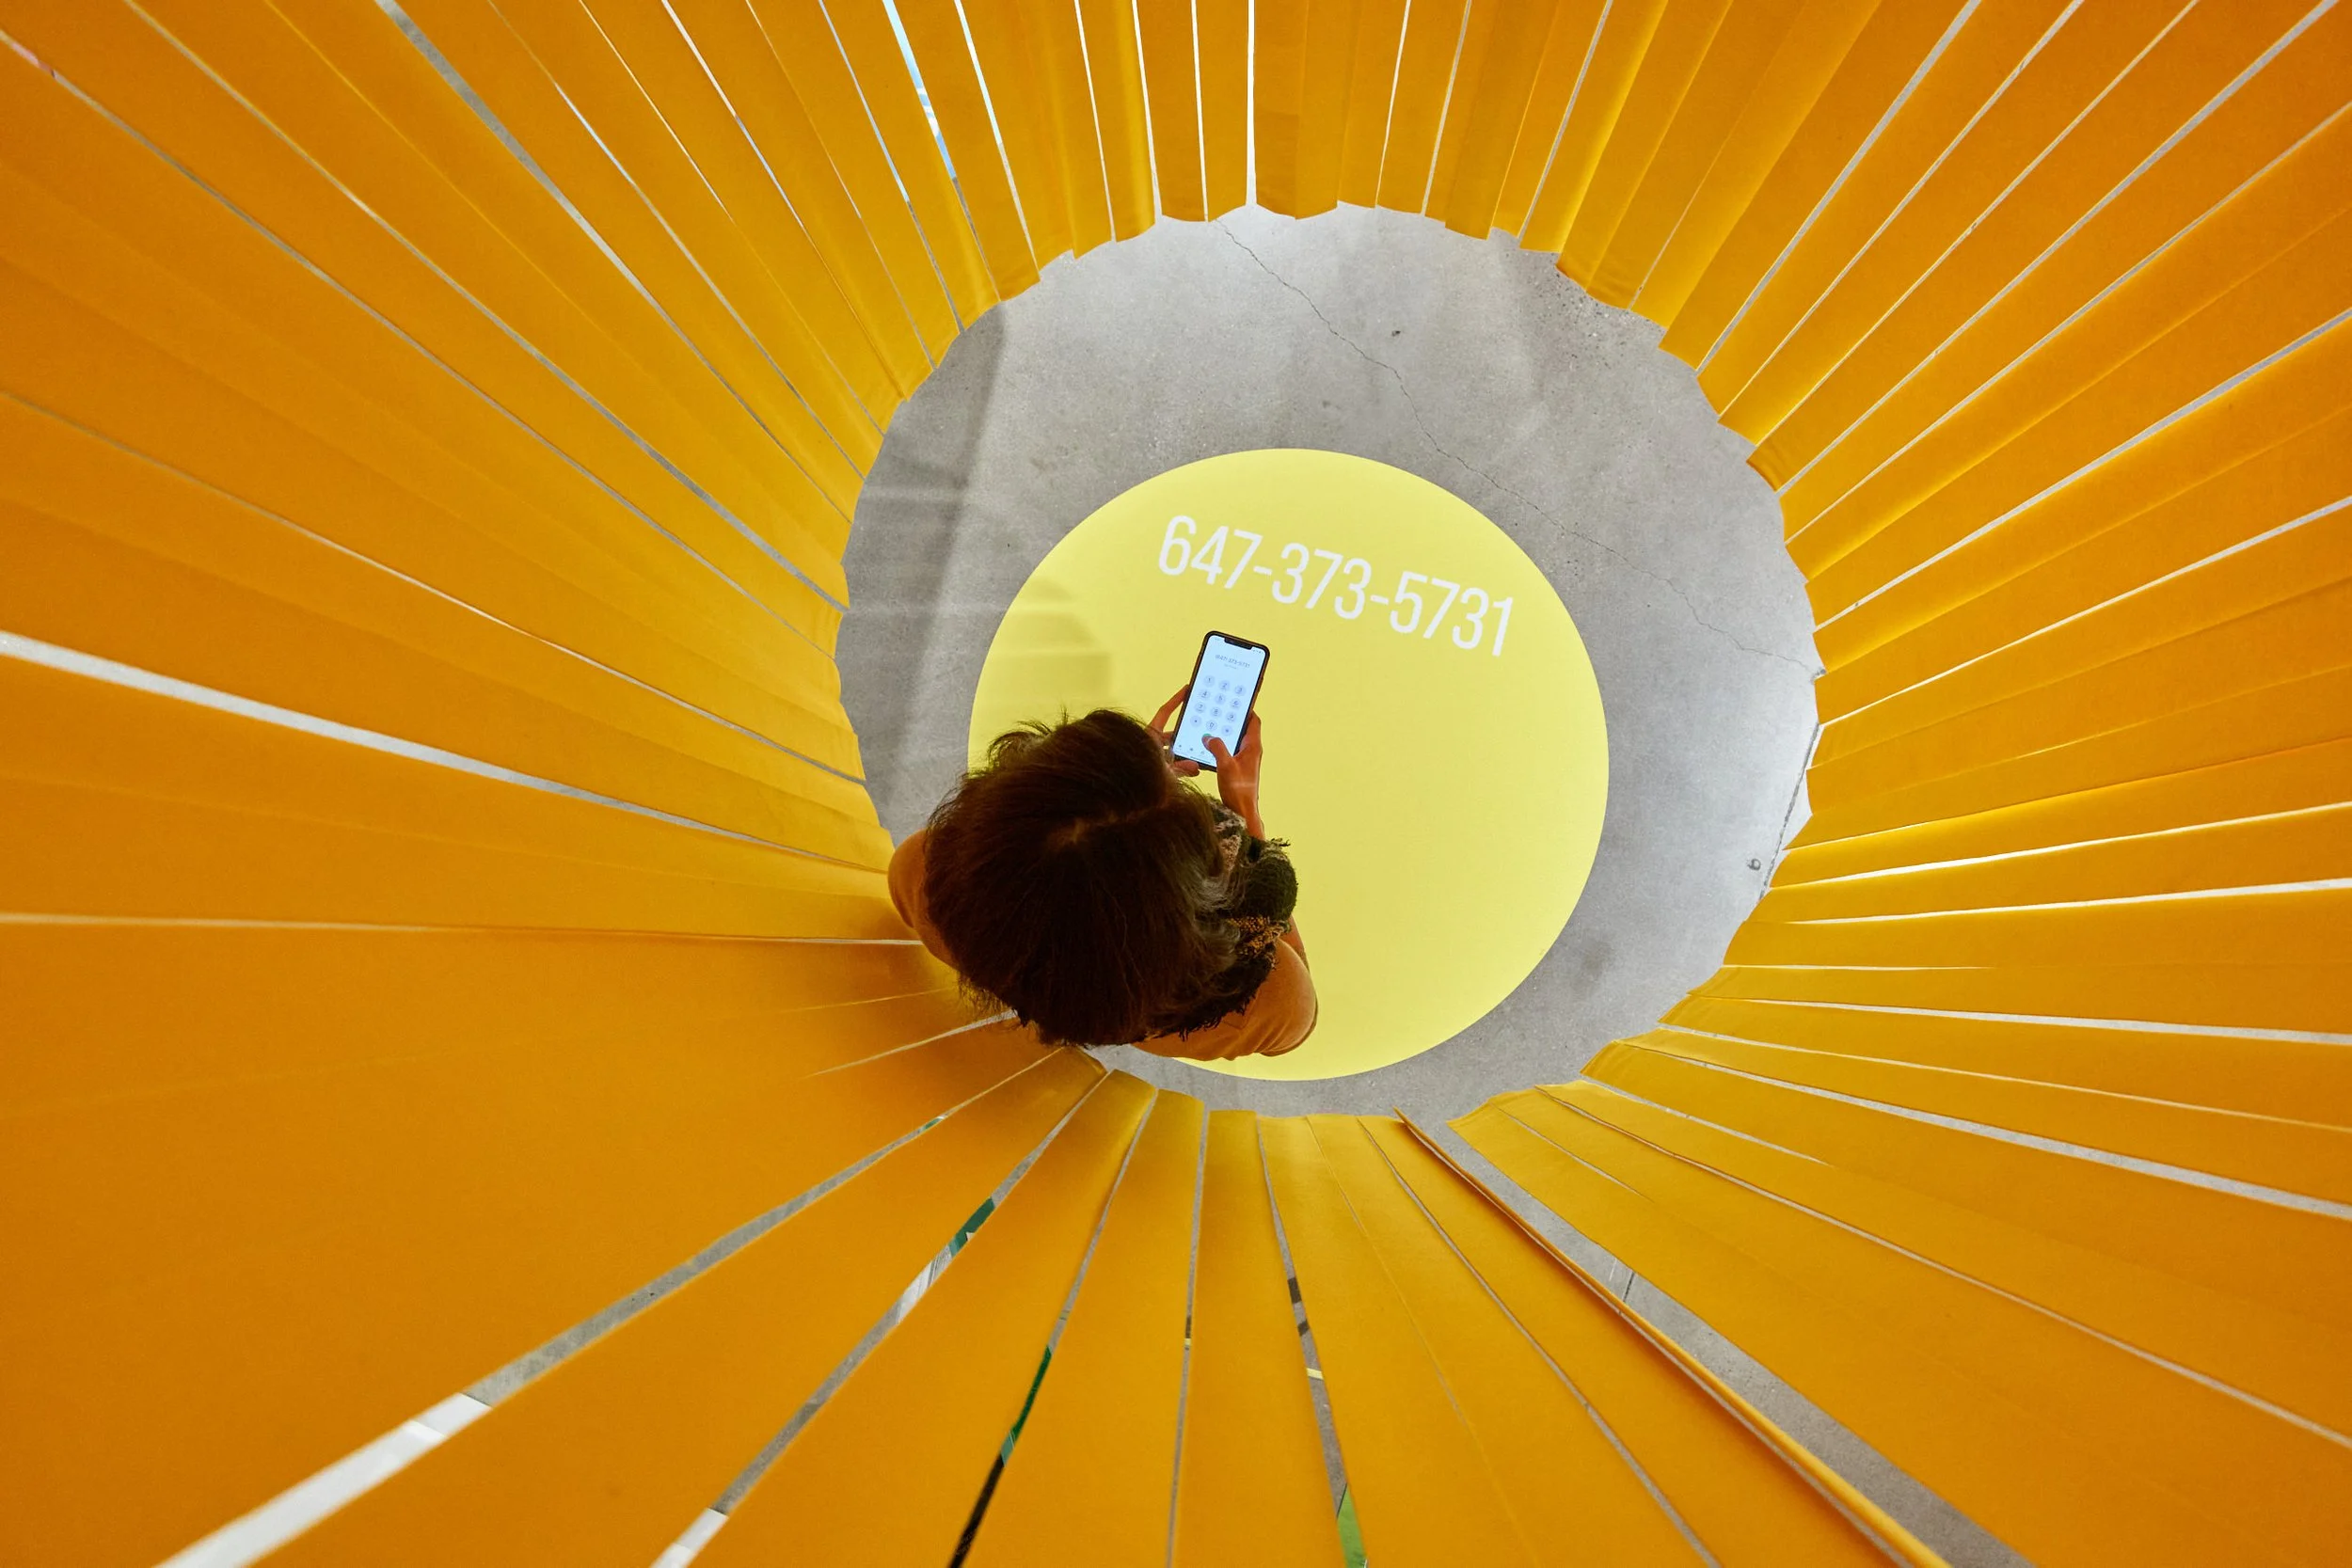
Located at the 401 Richmond galleries, the Myseum of Toronto is an interactive exhibit posing 36 questions about the visitor’s relationship with Toronto. The questions are spread across 6 interactive stations ranging in format. From writing “love letters“ to Toronto to recording voice memos, visitors are encouraged to add their answers to the exhibit.
How it works
Step 1
Visitors will be able to access a web link on their personal device through a QR code. Here, they will fill their name and be led to the main page.
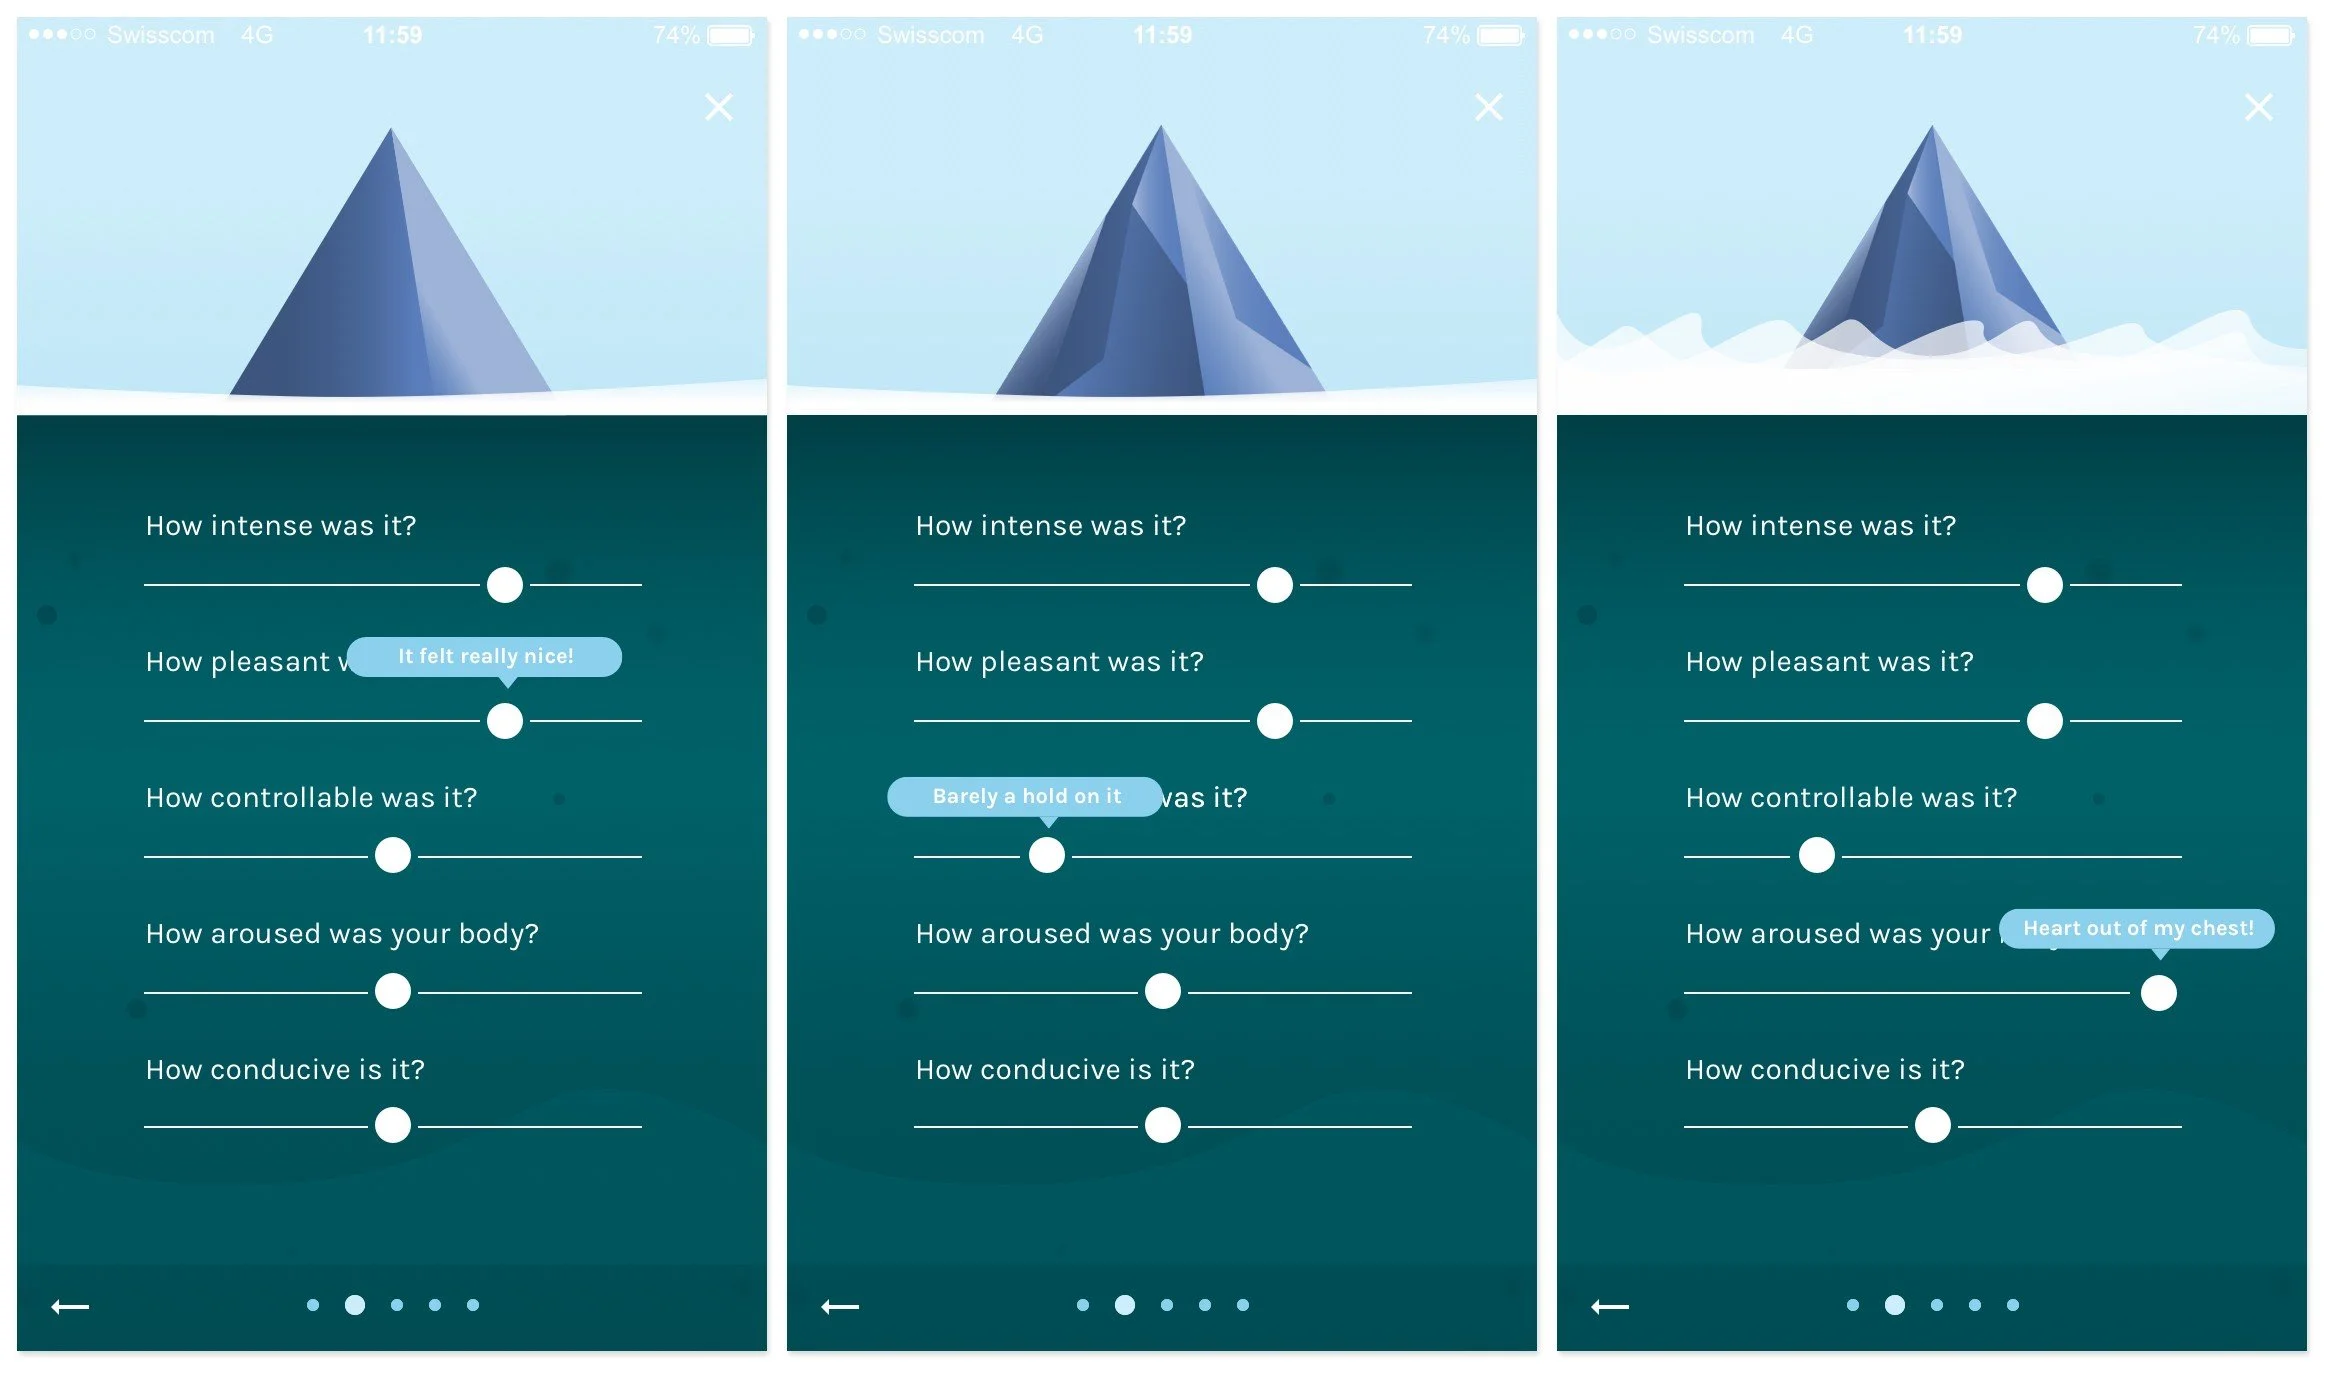
Step 2
From here, users will select a short survey dedicated to a station from the exhibit. The surveys are short and are meant to gage how the visitor felt about that specific station.
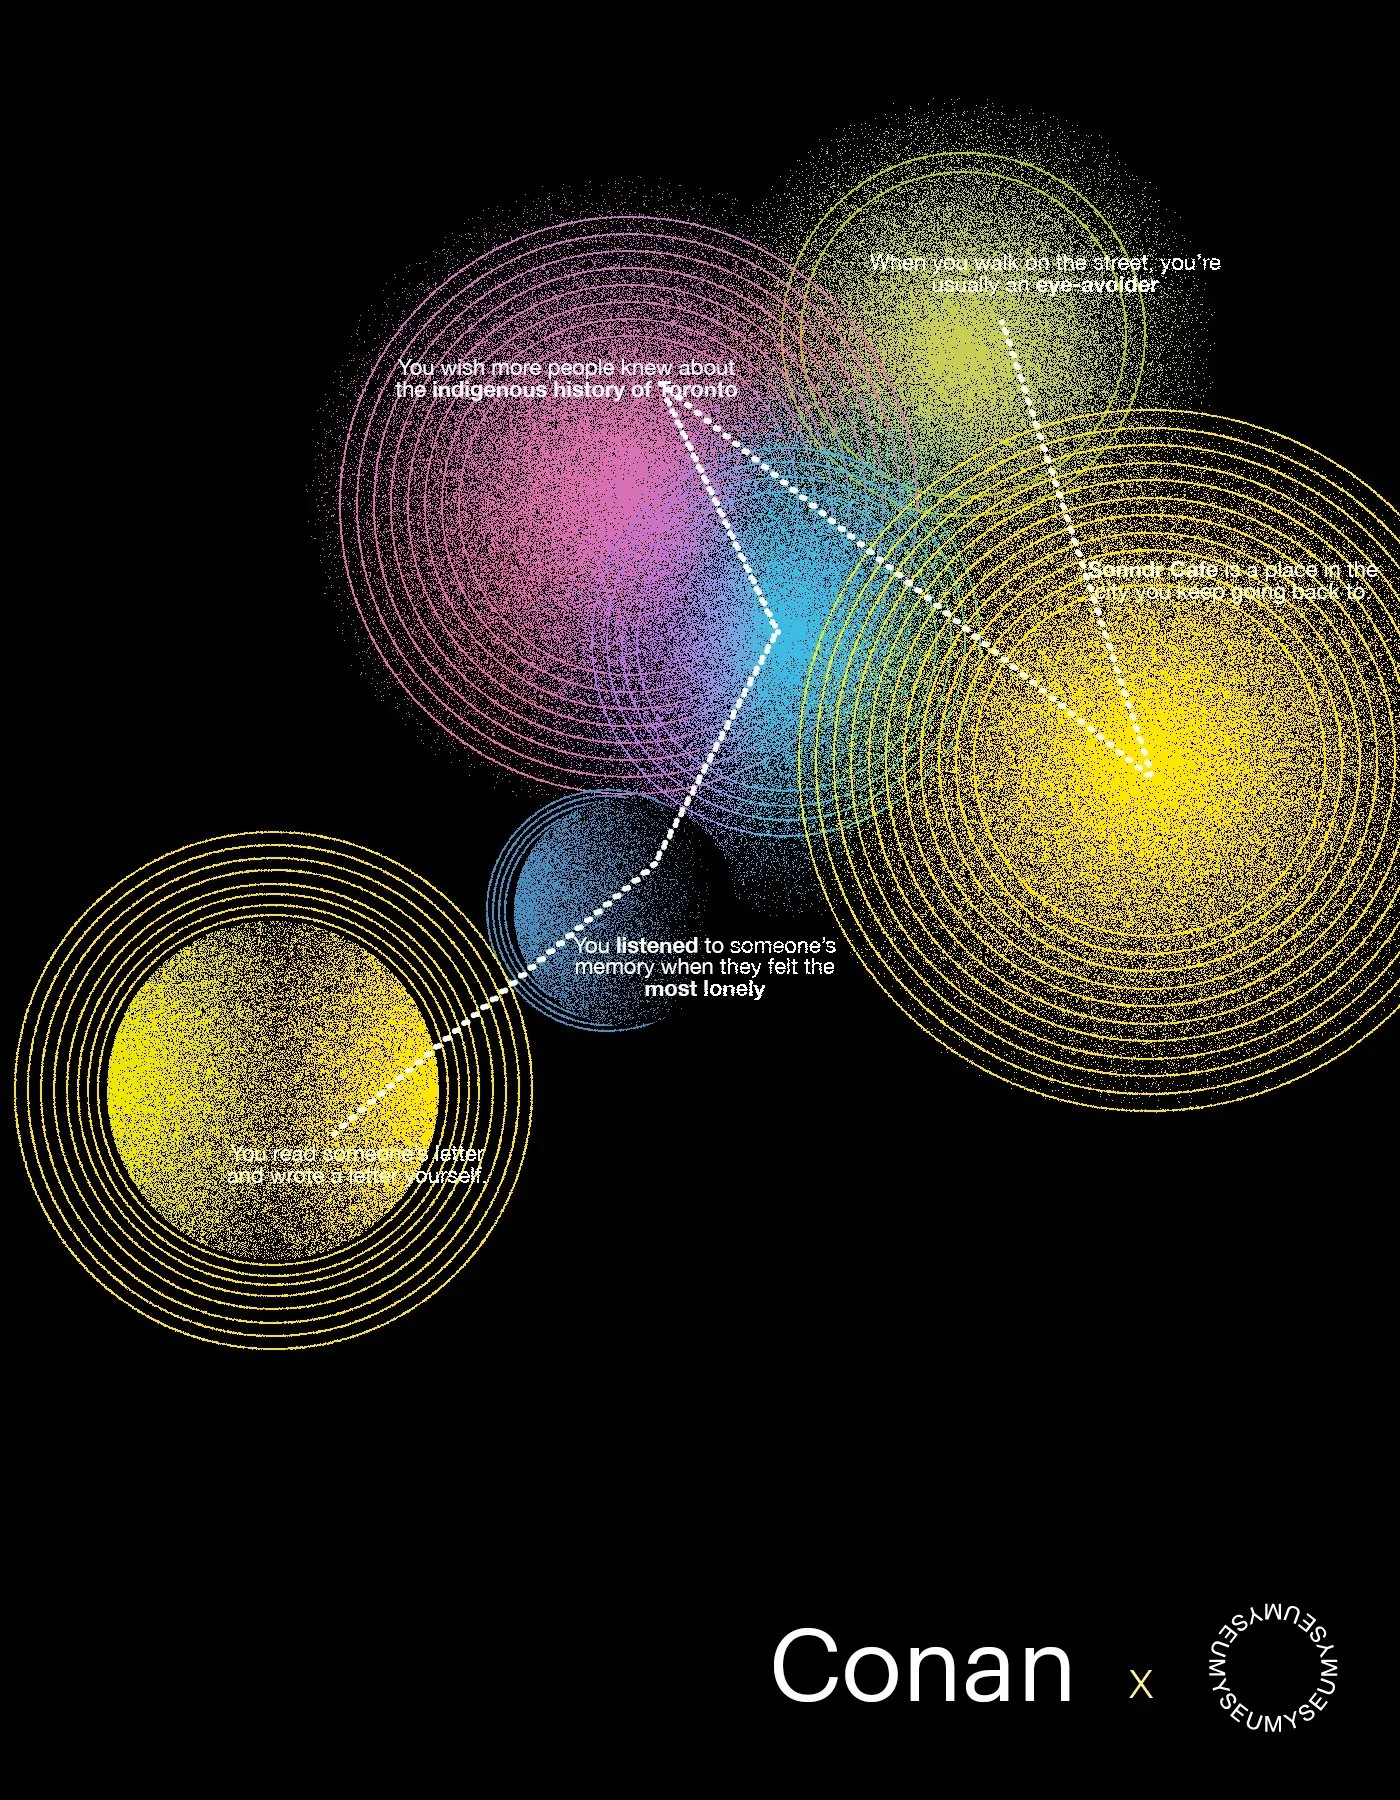


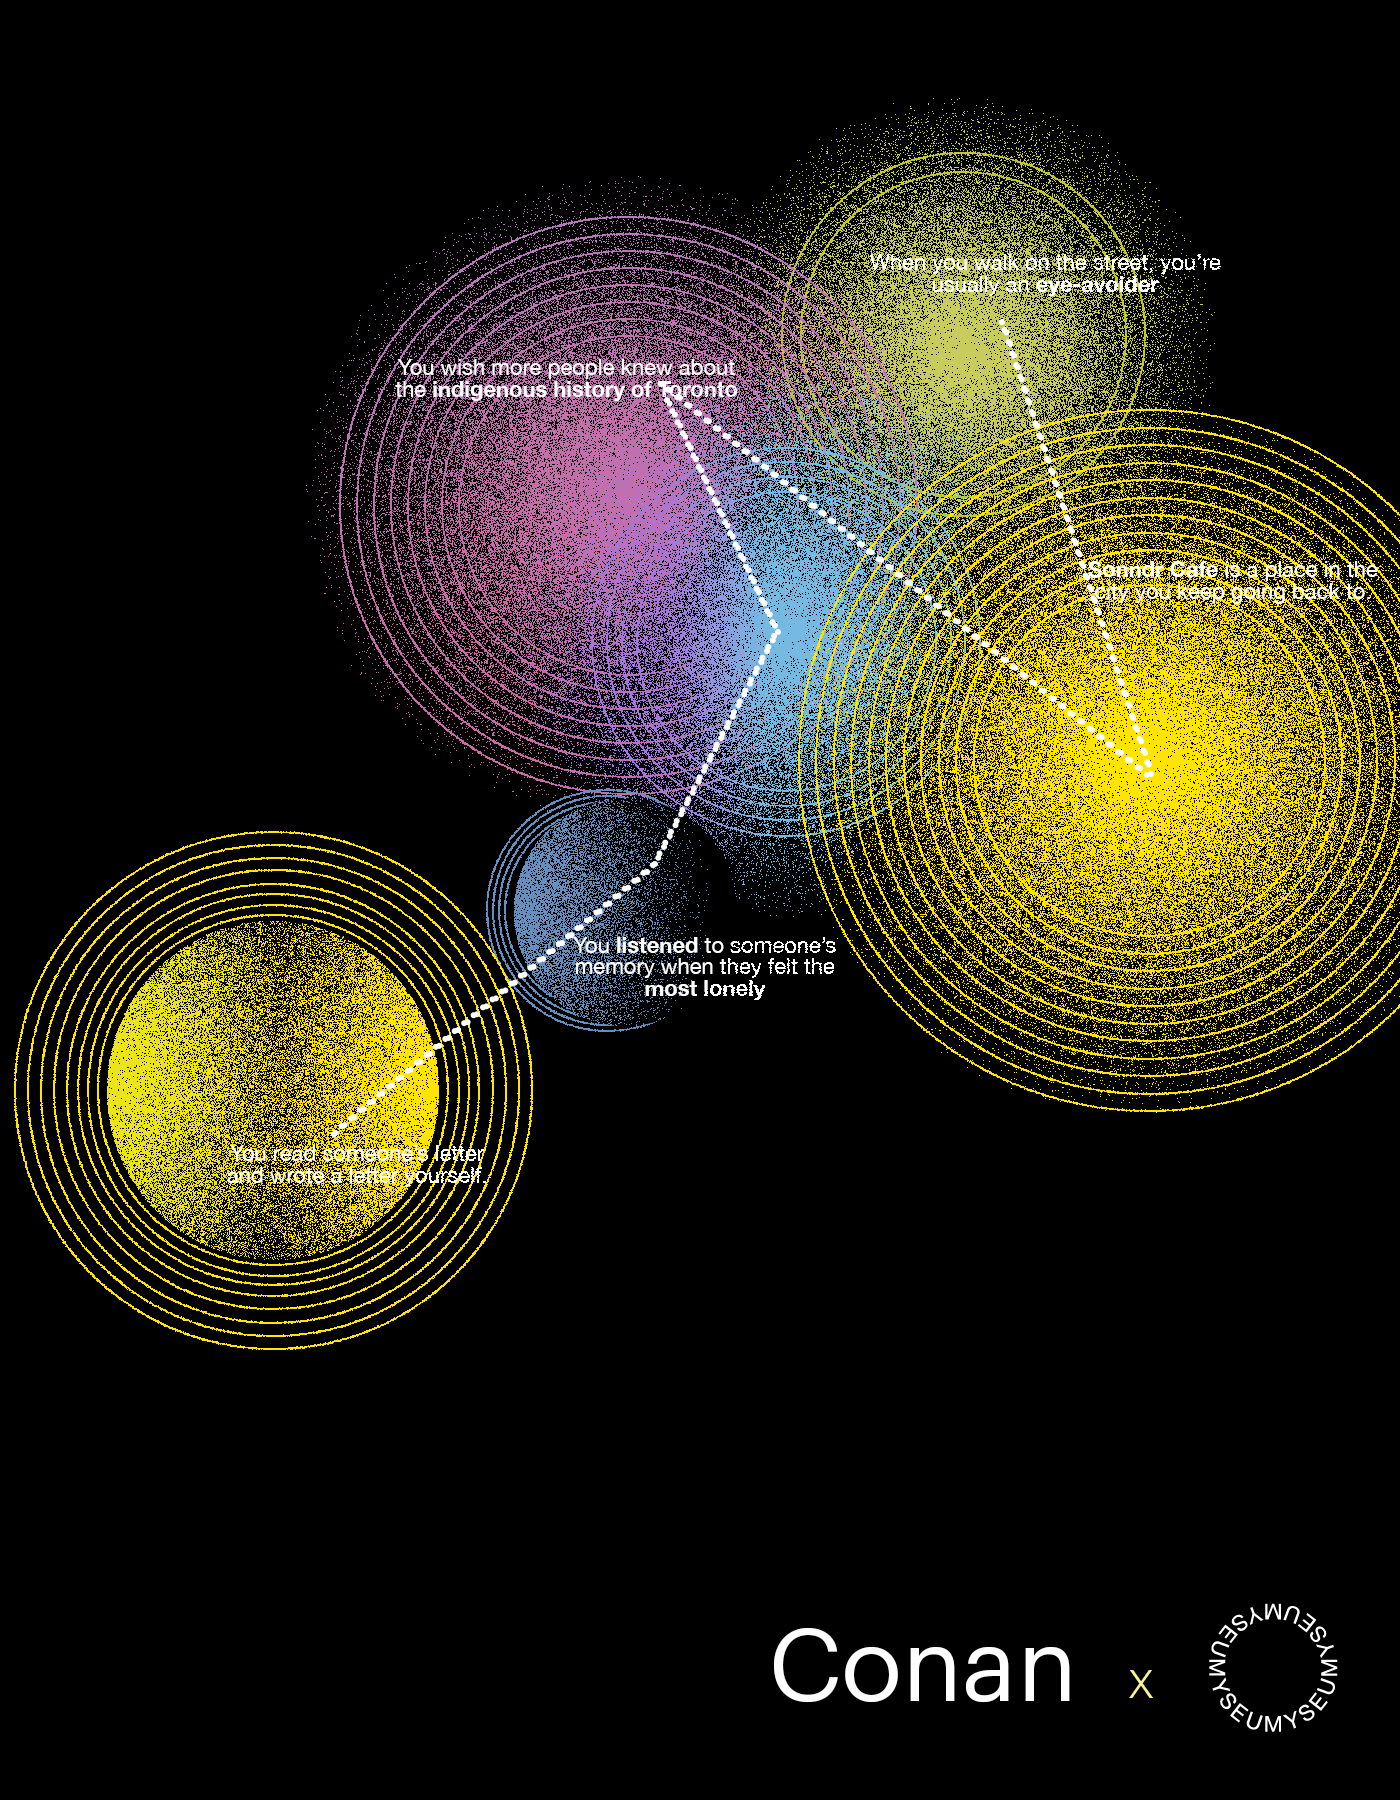
number of circles:
size / scale of emotion
color
emotion chosen on the scale
size
other visitors chose the same prompt
one side
visitor only listened or answered to the TO love line (one of the exhibit’s stations)
The final result

Other features
Share option